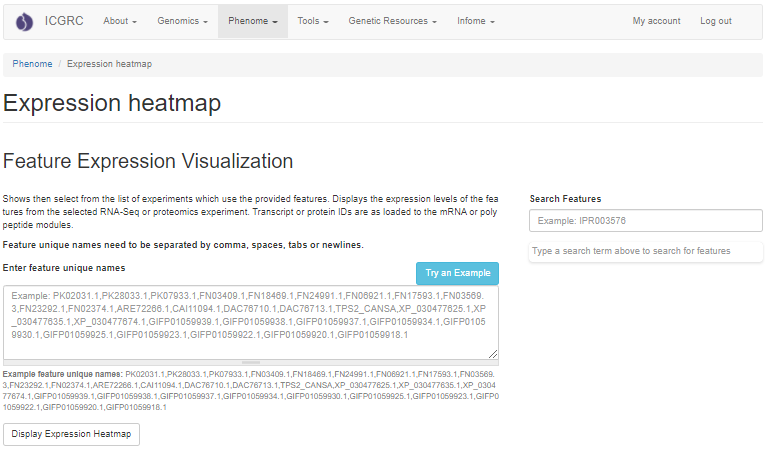
The expression data can also be viewed as a heatmap. To generate a heatmap, a list of feature names needs to be collected and input into the heatmap interface. Paste the list of feature names into the box and click "Display Expression Heatmap". The heatmap will then be displayed on the bottom half of the page.
Try an Example button uses a list of features to display all available expression studies.
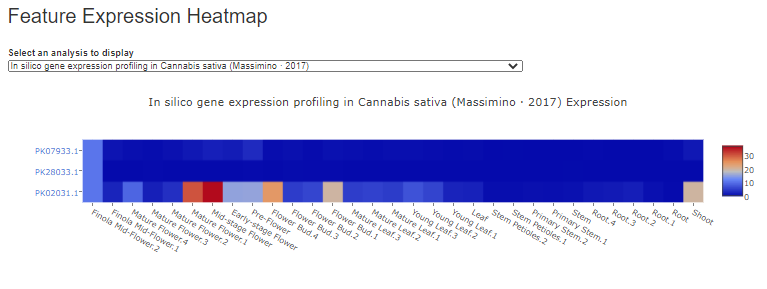
The heatmap has the feature names (with hyperlinks) on the y-axis and the biomaterial names on the x-axis. When the mouse hovers over a heatmap square, a summary of the data is shown. There are also heatmap display/export options that appear when the mouse hovers in the upper right corner.